Mysqlbench Server Status Metrics Meaning
Monitoring mysql server metrics is crucial for a DBA. Typically, we
can simply monitor the recent server status summary through mysqlbench.
But what's the meaning for these metrics? Some of them are
self-explained such as connections and traffic
while others are not. For example, what's the difference between
Selects per second and
Innodb reads per second? How to measure the write
performance?
The following figure illustrates the serve status: 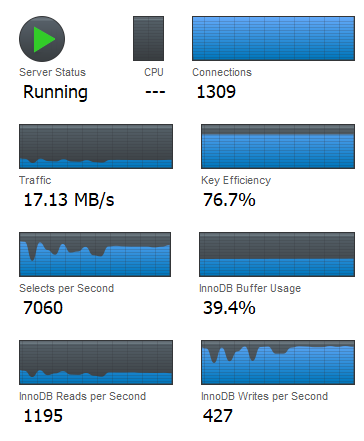
Server Status Metrics Definition
After some research, I found a nice
article which explain them well: Selects per second:
Com_select / second Innodb reads per second:
Innodb_data_reads / second InnoDB writes per second:
Innodb_data_writes / second
So what's the definition of Innodb_data_reads and
Innodb_data_writes? From mysql
reference manual: Innodb_data_reads: The total number
of data reads (OS file reads). Innodb_data_writes: The
total number of data writes.
Metrics Relationship
Selects per second vs Innodb reads per second
Look at the following figure and compared with the previous one: 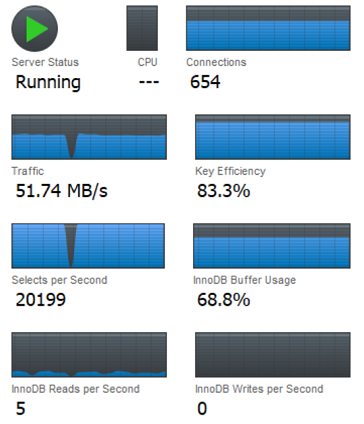
The interesting point is that with much higher
Selects per second, the
Innodb reads per second is almost 0. Why? The reason is
that most of the data including table and index are loaded into server
memory for the latter case. No file reads is needed for selects because
of the cache (most of the time).
Therefore, Selects per second is not equal or
proportion to Innodb reads per second. We can
verify this idea by looking at another metric
Innodb Buffer Usage which reflects the "cache" size, it is
much higher than the case with high
Innodb reads per second.
Comparatively, Innodb writes per second is able to
reflect the write performance. Because cache mechanism cannot be applied
to write operation.
IO/Memory Relationship during DB Startup
Let's consider another interesting observation: when we just start the DB, the query latency is relatively high. The latency will be gradually dropped down after running for sometime.
Yes, the magic part is the Innodb Buffer Pool. After running for a
long time, the hot data will be loaded into memory and the query latency
will be significantly reduced. So we should keep an eye on
Innodb Buffer Usage as well. What's
innodb buffer usage
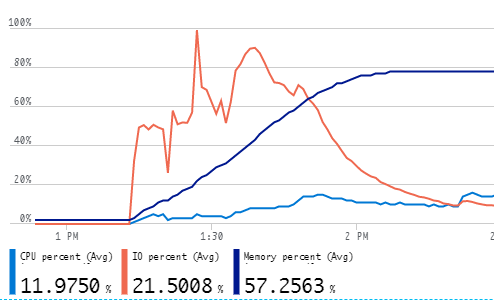
The above figure is the CPU, IO and Memory Usage Percent curve after a DB startup. Intially IO is high and memory usage is low, one hour later, the IO becomes low while the memory usage (innodb buffer pool usage) raises up to 80%.